Showing posts with label Hadoop. Show all posts

Monday, May 2, 2016

Data Quality Using R


Data Quality is a valuable approach to making sure that your data meets your needs and provides you with reliable information when it is needed. The problem is that most organizations are hesitant to embark on the data quality journey due to the costs. The challenge is how can we reduce the cost of data quality? Most organizations realize the value data has but the cost of software, people and time, end many initiatives before they begin.

Companies put together data management plans which require them to make investments. These investments tend to be in the area of data quality tools. Organization consider Data Quality products from Informatica, SAS, SAP, Trillium and Oracle, all provide tools that support this need using a well curated approach. These tools are add-ons or options to existing ETL toolsets, and generally they are expensive and complex to implement. However the advantage they bring is tight integration with ETL tools. Some companies may find that the barriers to entry are too significant and therefore often ignore or reduce their data quality efforts.

We need to find a better way or at least one which is more cost effective. Many enterprises today are enamored with open-source solutions. These are the companies who are actively embarking on open-source projects like Hadoop and the various projects within its ecosystem. One of those tools which has emerged as a tool that is commonly paired with big data is R. As defined by Wikipedia and the Inside-R Community; R is a programming language and software environment for statistical computing and graphics supported by the R Foundation for Statistical Computing. R is a programming language: you do data analysis in R by writing scripts and functions in the R programming language. R is a complete, interactive, object-oriented language: designed by statisticians, for statisticians. The language provides objects, operators and functions that make the process of exploring, modeling, and visualizing data a natural one. Complete data analyses can often be represented in just a few lines of code. The challenge is that R is limited by memory. So you do need to consider this when you choose the right sample for your tests.

At the recent Collaborate16 conference, I attended a session by Michelle Kolbe, of Red Pill Analytics, about using R for Data Quality. This idea was one I thought to be an eye-opener. A viable solution to our problem was right in front of us. She proposed that R provides the necessary features and analytics to support a robust data quality approach. R packages which are applicable to data quality include summary, distribution, histograms, regressions and dataqualityR. These packages allow us to profile data quickly and easily. The summary package, profiles each column in the file or table and provides information including min, max, median, distributions and other useful measures. By combining graphical and text mining packages allows for advanced visualizations like word clouds and clustering which can be more telling by providing visual clues leading to outliers and other questionable data. This functionality within R can empower a Data Quality program, by defining a standard framework, one can build a library of data quality processes with you only having to provide the file or table you wish to analyze. 

The choice to use R will probably be one which IT will initiate and is one which should support business needs and data requirements but it will not serve as a stand-alone solution rather a solution. We can look at R as a low cost alternative to the mainstream DQ tools, but it is not a complete solution and will require a data processing product such as Python. The idea I propose is that R could act as the initial tool to profile and identify data issues.  With a construction of a framework to make it easy to use, you will have the start of an advanced approach to quality. 

The age of Big Data has created the opportunity which R presents and you should consider it for your organization. Data Quality is an ancient problem that we have news ways to find and fix an old problem. Recently the CTO at Canadian Tire stated “We aren’t interested in best practices. That’s for our competitors. What we’re looking at is next practices.” This is how we need to look at R; it is the next practice which may become a best practice.

Tuesday, April 19, 2016

Oracle Users In Action (A Collaborate16 Conference Review)


The recent COLLABORATE16 conference held by the 3 major Oracle user communities (IOUG, Quest and OAUG) brought together individuals focus on Oracle technology, middleware and  applications such as JDE and PeopleSoft. The event was attending by about 6,000 professionals from around the world.

The 4 day event had many themes and introduced ideas but my thoughts was focused on the messages in the following areas:
  • The upcoming release of Oracle Database 13c. An updated version with expanded features. Still under NDA so we have little to discuss at the moment.
  • The Cloud
  • Business Intelligence (Discussion around the concept of bimodal BI)
  • Security
  • Big Data and Internet of Things
We all attend many sessions during a 4 day conference and people either make a great or insightful statement which we later quote or they use a quote to make a point. In one case the use of a quote made an impression on me. It was a quote by Edwards Deming in 1942 which continues to resonate today:

Scientific data are not taken for museum purposes; they are taken as a basis for doing something. If nothing is to be done with the data, then there is no use in collecting any. The ultimate purpose of taking data is to provide a basis for action or a recommendation for action. The step intermediate between the collection of data and the action is prediction.
-          W. Edwards Deming
o   On a Classification of the Problems of Statistical Inference, June 1942, Journal of the American Statistical Association.

This idea which Deming states is that we should not collect data without purpose, without a use case. He was working for the US Census Bureau and said that unless data is useful why collect it. We need to consider the same when we work with data today. We should not try and boil the ocean; rather we should look to use data with focus.

Core to the conference was discussion around the database. Seminars included backup, security, performance tuning and databases on appliances like Exadata. The conference also held Oracle 13c beta session about new functions and features and to prepare people for the upcoming release. It is expected that the next release of the Oracle database (13c) will be around the Fall or sooner, depending on how beta testing progresses but one can expect it will be out in time for Oracle OpenWorld at the latest. There was onsite beta testing taking place at the event for customers who are part of the beta program.  Enterprise Manager 13c which includes support for both on-premise and in-cloud databases is improved and extended.

A big topic of conversation was Cloud. This permeated across all technology and applications. Oracle is focused on becoming the biggest Cloud provider of databases, applications and other components provided through their SaaS and PaaS strategy. 


All products which Oracle provides are now available via the Oracle Cloud. This strategy allows for monthly feature and fix releases which are said to not impact past functionality…… current prices for the Oracle Cloud are quite aggressive in comparison to their competitors

Consider Oracle’s new Data Visualization product. This product to compete against products like Tableau are currently inly available as a desktop single user version or as a Cloud service. (https://cloud.oracle.com/en_US/data_visualization?resolvetemplatefordevice=true&tabID=1445271963053). This is indicative of the Cloud strategy where software is developed so that the minimum viable product is made available and then development of features continue.

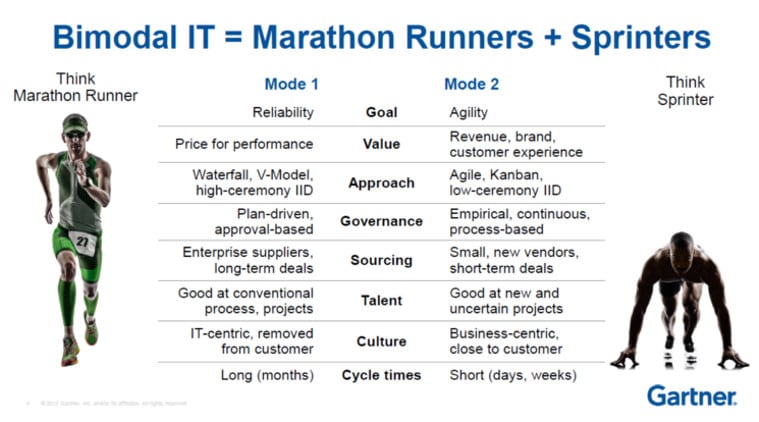
This leads into the new concept of Bi-Modal Business Intelligence. The concept of bi-modal is the merging of two approaches to information management. The first being the traditional approach where formal processes and policies are put in place to support well defined and mature requirements. The second mode is one which is more Agile and addresses issues using an approach of discovery. The following slide from Gartner provides some guidance on the differences between the two modes:
This approach was originally created to support a general change to how development works and to introduce Agile into the workplace, it has been further extended for BI. The following illustrates these modes as they relate to Business Intelligence:


One seminar talked about how the Oracle tool set addresses these 2 modes of operation. Oracle and a couple of the speakers address the question by suggesting that the Oracle BI suite satisfies both sides of the equation. The idea is that OBIEE is the Mode 1 approach with highly governed and structured approach to reporting. Although the product does include the ability for some individuals to create Mode 2 reports, the requirement for curated data defined by the semantic layer does go against some of the concepts within the definition of Mode 2.  Oracle is now offering Oracle’s Data Visualization (DV). This is the product Oracle has released to compete with Tableau. The advantage is that you can better govern the data access to data sources which is a step ahead of Tableau which thrives on using non-curated data. At this point this product should appeal to organizations who wish to reduce the complexity of tools which they support. DV is currently only available as a Cloud service. There was some discussion of making it available as a stand-alone version, but not as a server-based version.

The conversation around Security continues to be a big concern for most database professionals. The speakers discussed methods for securing data which includes masking and other advanced methods of encryption. When using Oracle there are enough features when used in the basic and advanced security features that no database today should be left unprotected. Generally the issues are caused by organizations not using what is available today. In the Big Data space, security continues to be an issue. The Data Lake is presenting new challenges to ensure that data in Hadoop is protected. Most organizations today merely place Data Lakes in restricted areas/servers. This is really only the first step, security is developing in the space and should be a major concern. In a recent survey, Oracle customers stated that security and performance are the two major concerns with the adoption of Big Data in their organization.

During the opening session the results of a survey of Oracle users was presented on the topics of what people are doing and planning and what are the biggest challenges they are experiencing. The key findings were around the adoption of Cloud which is advancing while Big Data is moving with more caution.  A good summary of this discussion may be found at; http://www.dbta.com/Editorial/News-Flashes/Ground-Breaking-Research-on-New-IT-Trends-Adoption-is-Presented-at-COLLABORATE-16-110361.aspx

The last area which I will focus on is that of Big Data and IoT. The conversation of the topic continues at the periphery of this group. While almost all attendees have Data Warehouses, few have active Big Data initiatives and fewer in IoT. One interesting presentation was about using R for Data Quality. I found this to be a great approach to using the new Big Data tools to ensure quality within the repository. The use of R provides many of the statistical methods which may be used to profile data. I thought this was a good approach to how one may implement a DQ profiling approach. The presentation may be seen at: http://www.slideshare.net/michellekolbe/data-profiling-with-r

I find it interesting that this user community continues to be very much focused on databases and not in the evolution of data. They are doing a good job in sharing information about the database, middleware and applications but they also are more resistant to newer technologies like the transition to Big Data. This may be the nature of this group, but considering that the people here are the technologists who manage most of the business critical applications the biggest trend for them is moving to the Cloud, and to a lesser extent the data which is being generated by these applications.